Benchmark Function for SSD and SSD/NVMe
SSD, SSD/NVMe向けのベンチマーク機能

For SSDs and SSD/NVMe, we investigate using a variable size… that is, by altering what is commonly referred to as the volume.
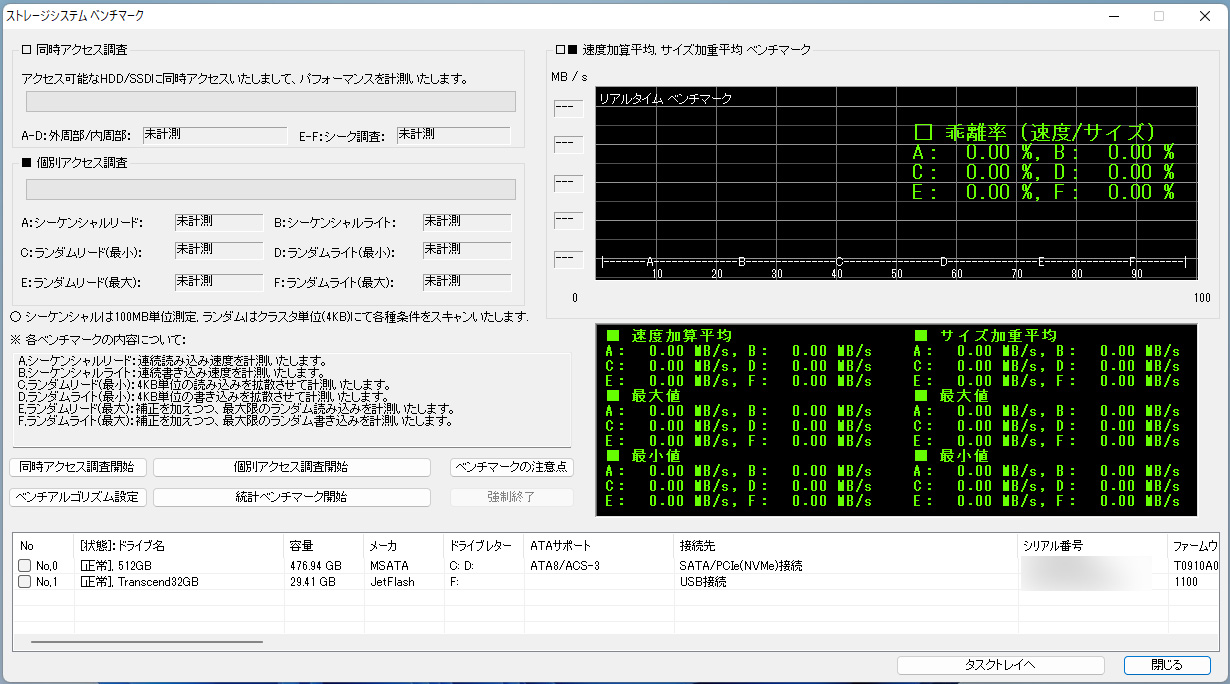
SSDやSSD/NVMeについては、サイズ可変……いわゆるボリュームを変動させることにより調査します。

Concept of Volume
ボリュームの概念

The purpose of benchmarking is primarily to measure transfer speeds conditionally. The concept of volume refers to the thickness that supports the numbers obtained from the benchmark. Because the measurement locations in benchmarking change rapidly, it is difficult to directly quantify volume, and even if all locations are written to, they can be overlooked. Therefore, we rely on an alternative method instead of such quantification. This is graphing. This thickness can be connected to the stable shape of the graph, allowing us to confirm it firmly without direct numerical values.
ベンチマークは主に転送速度を条件付きで測定することを目的といたします。ボリュームとはベンチマークで得られました数値を支える厚みの概念となります。ベンチマークは測定の場所の移り変わりが早いためボリュームを直接的に数値化することは難しく全ての個所に書き込んだとしても見逃されてしまいます。ではそのような数値化ではなく別の手段に委ねるのみです。それがグラフ化です。 この分厚さをグラフの安定形状につなげ直接的な数値でなくてもしっかりと確認することができます。

For example, there are SSDs with write speeds of 1500MB/s (SSD A) and 1200MB/s (SSD B). The concept of thickness that can support these values is the acceptable size. Simply looking at these values on the product package, one might tend to judge SSD (A) as stronger (and more expensive). However, when the total write size exceeded 50GB, only SSD (A) showed a rapid drop to about 700MB/s followed by fluctuations, while SSD (B) remained stable. Can SSD (A) still be considered stronger in this case?
たとえば書き込み側1500MB/sのSSD(A)と1200MB/sのSSD(B)があります。ここでこれらの数値を支える厚みの概念となりえるのは受理可能なサイズです。製品パッケージに記載されるこのような数値だけ眺めればSSD(A)が強いと判断してしまいがち(しかも高価)です。しかし書き込み総サイズが50GBを超えたあたりからSSD(A)でのみ700MB/s程度まで急落のち乱高下しました。そしてSSB(B)は変わらず安定しています。これでもSSD(A)が強いと示せますでしょうか?

Discrepancy Rate
乖離率

Once we graph the concept of thickness, we also create a graph without this concept simultaneously. Having obtained multiple graphs derived from the same standpoint, the next step is to overlay them. Then, by extracting the proportion of differences between the graphs, we obtain the discrepancy rate. We focus on SSDs with a large discrepancy rate (e.g., frequent occurrences of 20-30% or more).
厚みの概念をグラフ化いたしましたらこの概念を抜き取ったグラフも同時に作ります。同じ立ち位置から派生した複数のグラフが手に入りましたのでここでやるべきことは、重ねる事です。そして、グラフ同士の差分の割合を取り出していきますと乖離率が手に入ります。乖離率が大きなSSD(例:20~30%以上が多発)に着目していきます。

Examples of Discrepancy Rate
乖離率の例

〇 WesternDigital 240GB
〇 Transcend 240GB
〇 Intel 180GB
〇 WesternDigital 120GB
〇 Silicon Power 120GB
〇 Crucial 275GB
〇 SanDisk 240GB
〇 Kingston 120GB
〇 ADATA 240GB
〇 Intel 512GB

In addition to the normal benchmark (arithmetic mean), we support a weighted average (size) that includes the concept of thickness. This becomes a strategy against storage algorithm manipulation when deployed in containers without rearranging light sizes.
通常のベンチマーク(加算平均)以外に加え厚みの概念を加える加重平均(サイズ)をサポートしております。コンテナに搭載の際、軽いサイズを再配置せずに大きく引っ張り格納アルゴリズム対策となります。

Drive Load
ドライブへの負荷

The load on the drive for adequately representing the concept of thickness is defined as follows:
厚みの概念をしっかり出すためドライブに対する負荷を以下のように定めております。

+3σ:Ideal continuous access 理想的なアクセスが継続
+2σ:A certain amount is close to ideal 一定量が理想に近く
+1σ:
±0:Normal load 通常負荷
-1σ:Moderately heavy ほどほどに重い
-2σ:Continuous situation under strenuous load きつめの負荷が継続する状況
-3σ:Sudden fluctuations 急激な変動

Benchmarking SSDs Involving Algorithms
アルゴリズムが絡むSSDのベンチマークについて

For hard disks constrained by physical operations, an ordinary average is sufficient. However, for SSDs, where most operations are determined by firmware, an ordinary average is considered insufficient. For example, “where to place the processing of variable containers that take time” can significantly change results. Symptoms such as being unusually delayed when slightly larger-sized data continuously arrives can occur.
物理的な動作による制約があるハードディスクは普通の平均で十分です。しかしファームウェアで動作の大部分が決まるSSDについては普通の平均では厳しいと判断できました。たとえば「時間を要する可変コンテナの処理をどの場所に持ってくるのか」これだけでも大きく変わります。少しサイズが大きめなデータが連続して到達いたしますと異様に待たされる等の症状が出ます。

Furthermore, it can cause logical damage that necessitates repairs through disk checking due to adverse effects on the filesystem driver. When operating SSDs, if filesystem errors occur, it is necessary to prioritize backups and address them without delay. SSDs with a very high write-side discrepancy rate (e.g., frequent occurrences of 20-30% or more) can be considered to have a high risk of such issues.
またファイルシステムドライバに悪影響が発生しチェックディスクにて修復を要する論理的な損傷を抱える原因にもなります。SSDを運用中、気になるファイルシステムのエラーが生じた場合はバックアップを優先しつつ、放置せずに対処する必要性があります。 乖離率について書き込み側の剥離があまりにも大きなSSD(例:20~30%以上が多発)はこのようなリスクが高いと見込めます。