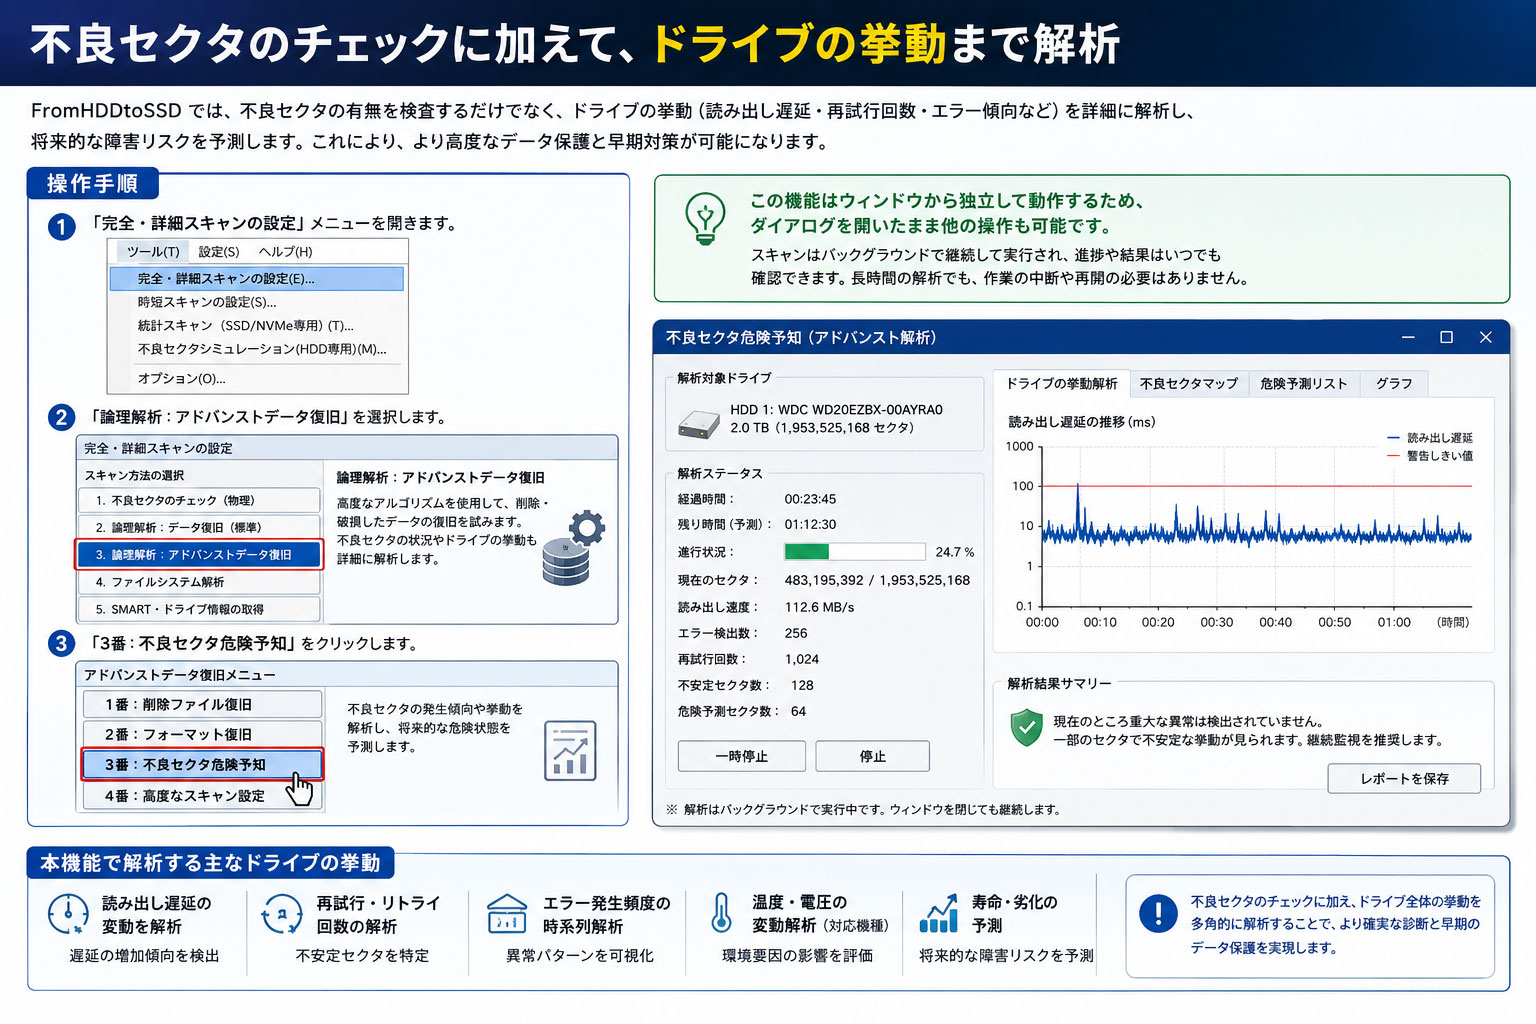
不良セクタのチェックに加えて、ドライブの挙動まで解析
「完全・詳細スキャンの設定」メニューから「論理解析: アドバンストデータ復旧」を選択し「3番: 不良セクタ危険予知」をクリックしてください。
この機能はウィンドウから独立して動作するためダイアログを開いたまま他の操作も可能です。
まずは機能を有効化します
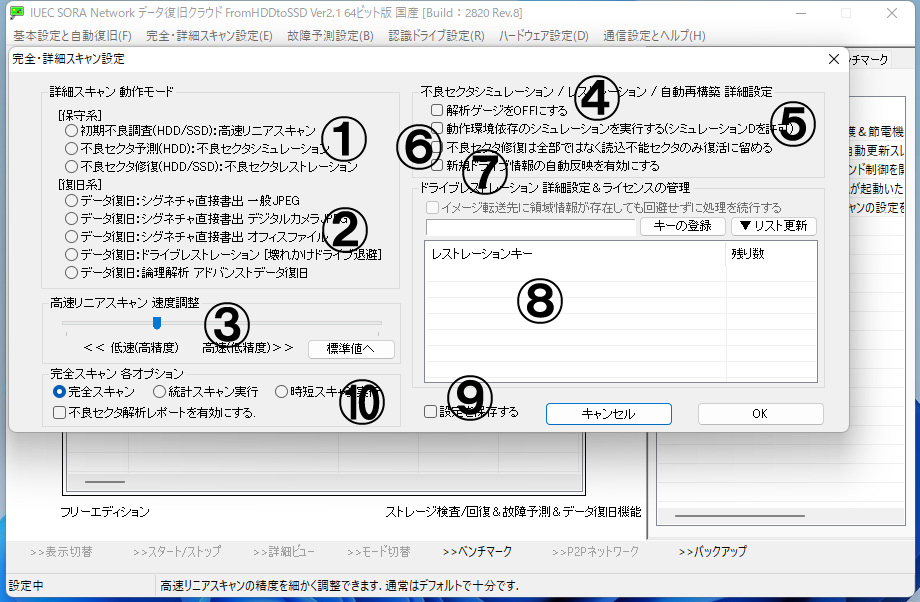
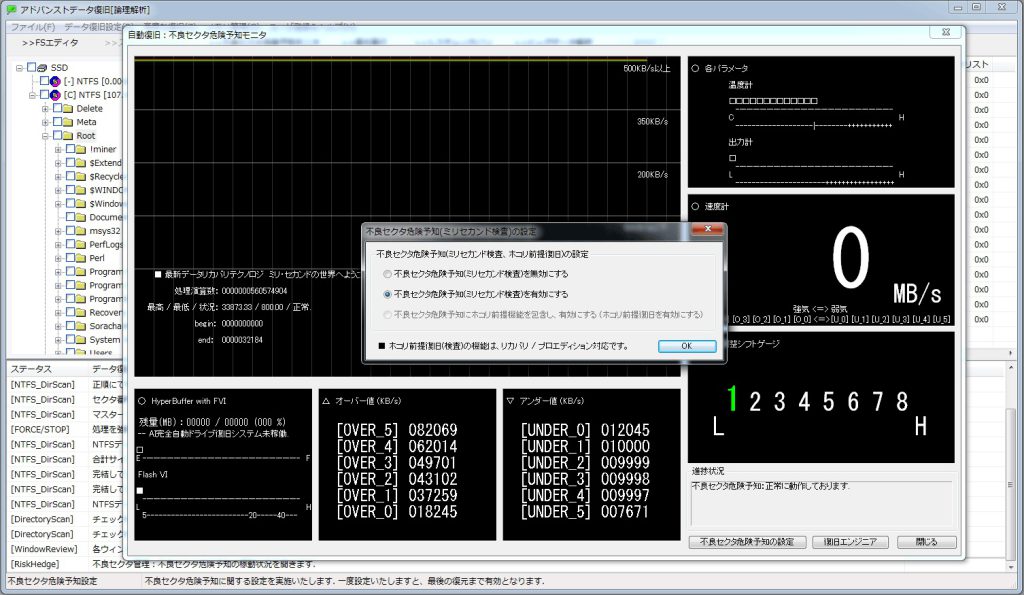
「1番: 不良セクタ危険予知(ミリセカンド検査)の設定」を開き「不良セクタ危険予知(ミリセカンド検査)を有効にする」にチェックを入れます。
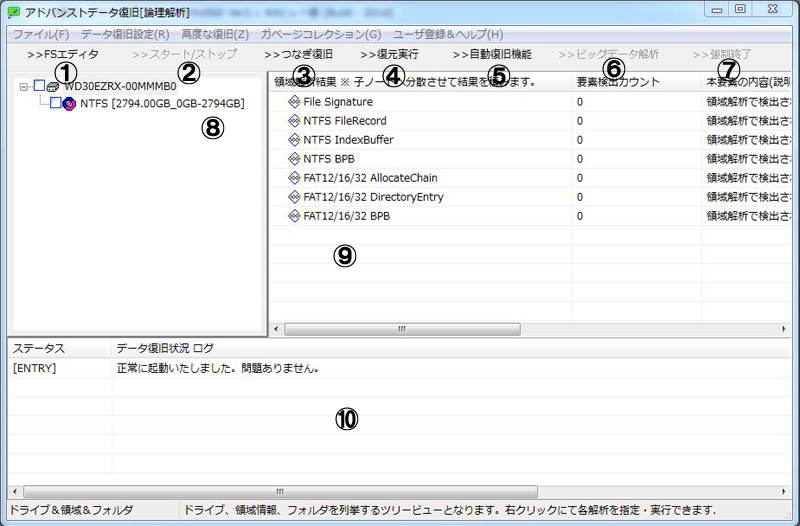
ダイアログを閉じずに右へ寄せ、左上のツリービューでドライブ名をダブルクリックし一番上にある「ディレクトリ構造解析」を実行してください。
解析結果が流れ始め構造解析が完了するのを待ちます。
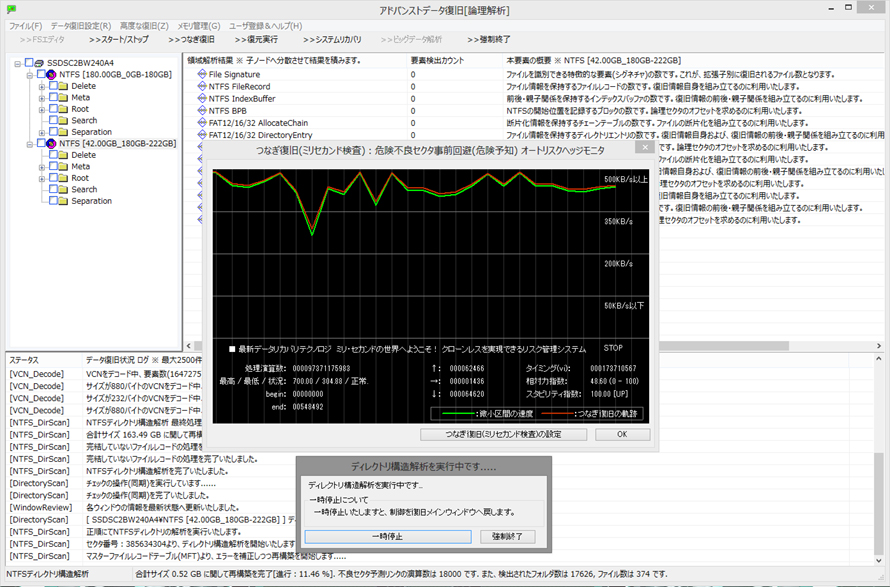
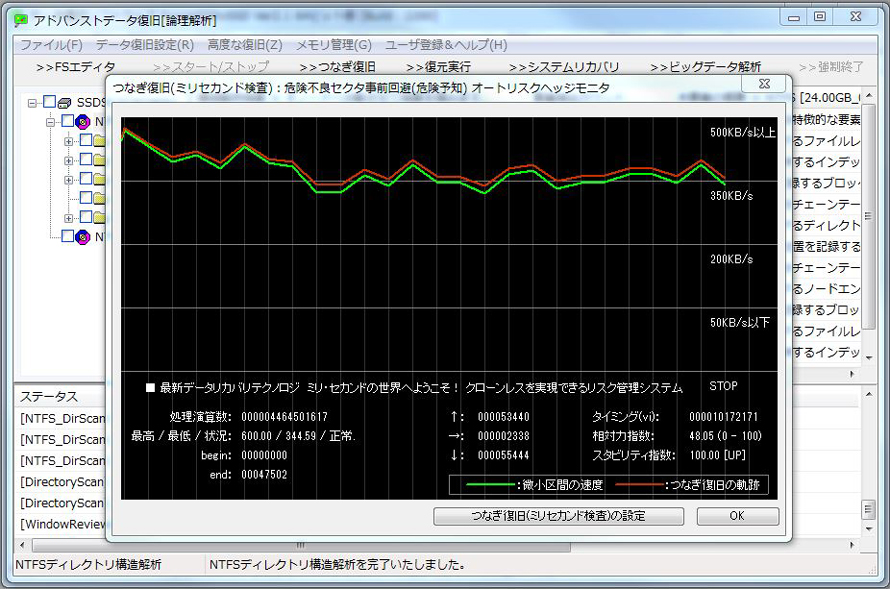
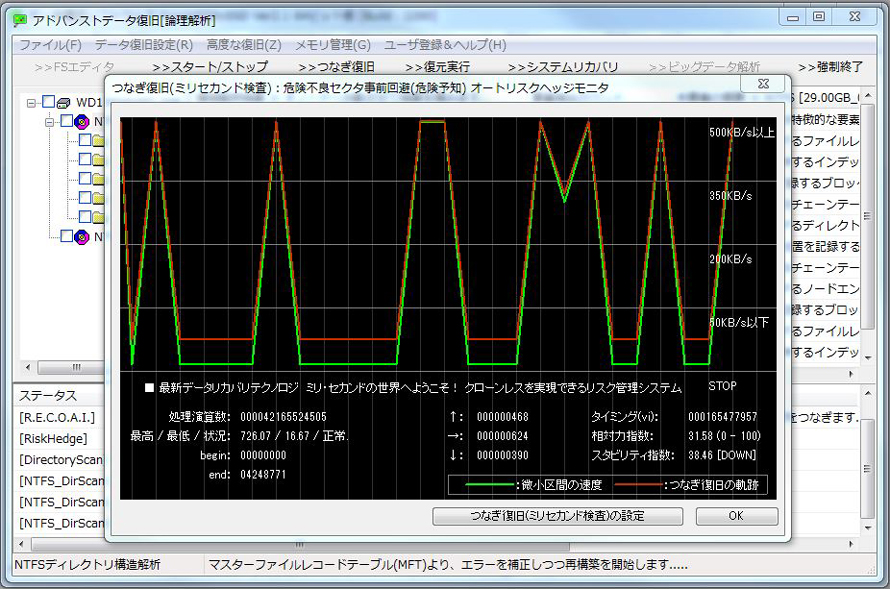
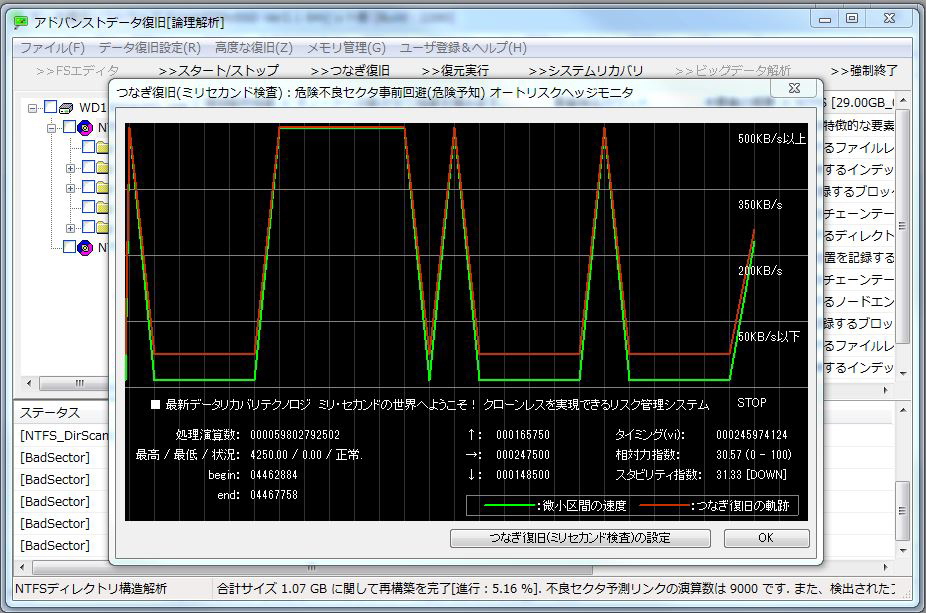
【画面構成の説明】
- 2番: グラフがリアルタイムで変化します。安定したドライブはグラフが上部で張り付くか一時的に下がってもすぐに回復します。
- 3番: 処理量が表示されます(主にデバッグ用)。
- 4番: グラフの動きを「上・微変化・下」で数値化し視覚的に方向性を判断できます。
- 5番: 解析結果の中で特に重要なのが「スタビリティ指数」です。この指数はドライブの健全性を表します。
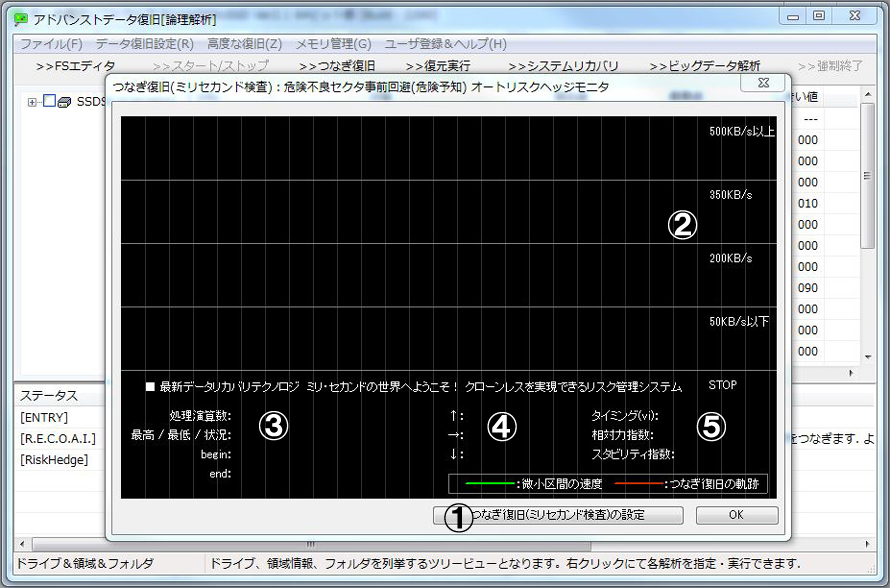
[UP] 判定なら特に問題なくスタビリティ指数は60〜100で安定しています。一方、[DOWN] 判定になるとスタビリティ指数が50以下に低下しドライブに弱い部分が多く現れている可能性が高まります。
【判定例】
- 正常なドライブでは最後に [UP] と表示され問題なく終えられます。
- 開始直後から異常が発生している場合は[DOWN] と判定され、グラフも下降傾向を示します。
- ヘッド系統に異常があるドライブでは回復せずにそのまま下降し続けることもあります。