- This feature executes an inspection that trace the file system.If the drive is about to break, the random performance will obviously be reduced and the speed of traversing the file system will be affected.For this reason, it has become possible to perform a combination of milli second inspection and complete scan to inspect physical and logical normality.
- Before using this feature, running a full-scan or a stat-scan to confirm that there are no bad sectors. Finally, we will take a look at the operation and behavior (whether it is weak or not) of the drive with “millisecond inspection”.
- Open the menu at the top → “full/detail scan settings” and select “Logical analysis: Advanced Data Recovery” from the second item.
- From No.4, choose the drive to run the inspection. Then click No.2 to open Advanced Data Recovery.
- Click No.3 “Bad Sector Danger Prediction”.
- First of all, enable this feature.
- Choose “Enable bad sector risk prediction (millisecond inspection)” in the center from No.1 and click OK (No.2). The millisecond test is now valid. Actually, the bad sector danger prediction is diverted to the inspection.
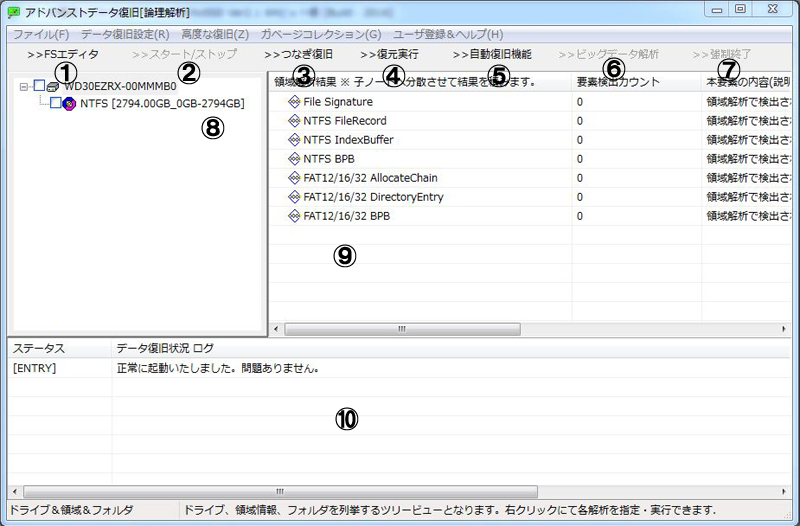
- Do not close the “Bad sector danger prediction” dialog that appears move it to the right,and double-click the drive name in the upper left (tree view).Right-click on the area where run the inspection, and a menu will appear in the red circle above, click “Run directory structure analysis” at the top from here, and the process will start.
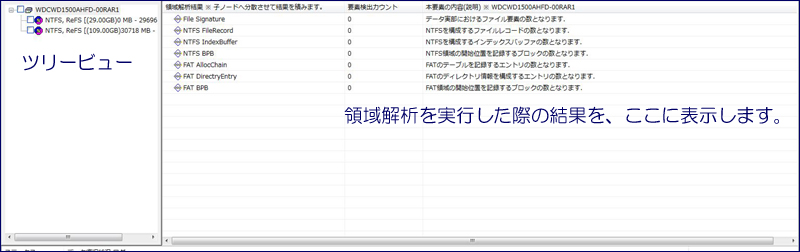
- The analysis results will be displayed in a flowing. Then wait for the structural analysis to complete. By the way, this is a graph shape that is a normal sign, in the new UI, here is the graph in the upper left. We developed this dialog by extending this feature.
- How to consider the graph
- If there is no problem, to end with [UP].
This feature executes an inspection that trace the file system.
If the drive is about to break, the random performance will obviously be reduced and the speed of traversing the file system will be affected.
For this reason, it has become possible to perform a combination of milli second inspection and complete scan to inspect physical and logical normality.
Before using this feature, running a full-scan or a stat-scan to confirm that there are no bad sectors. Finally, we will take a look at the operation and behavior (whether it is weak or not) of the drive with “millisecond inspection”.
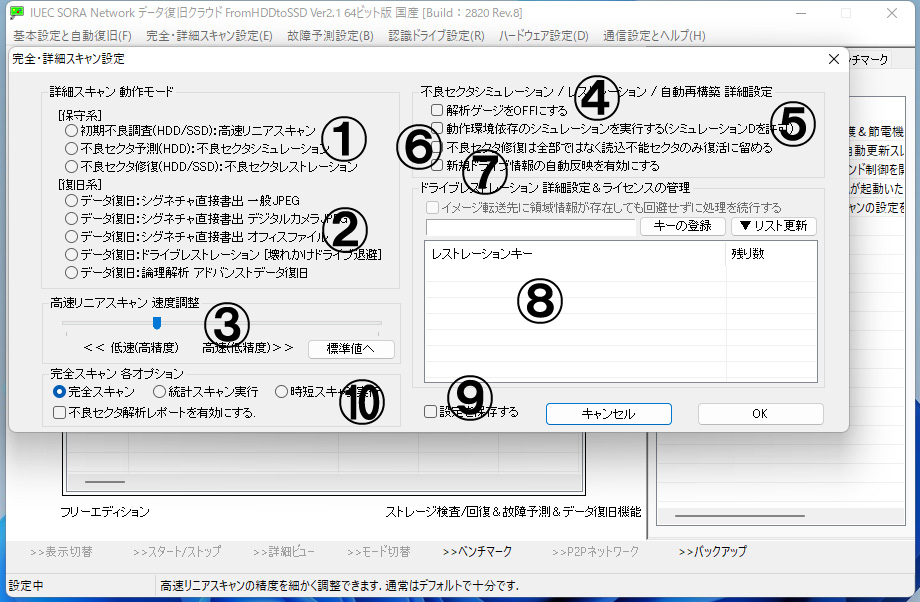
Open the menu at the top → “full/detail scan settings” and select “Logical analysis: Advanced Data Recovery” from the second item.
Millisecond inspection is developed from data recovery. Therefore, it will run inspection from the data recovery feature.
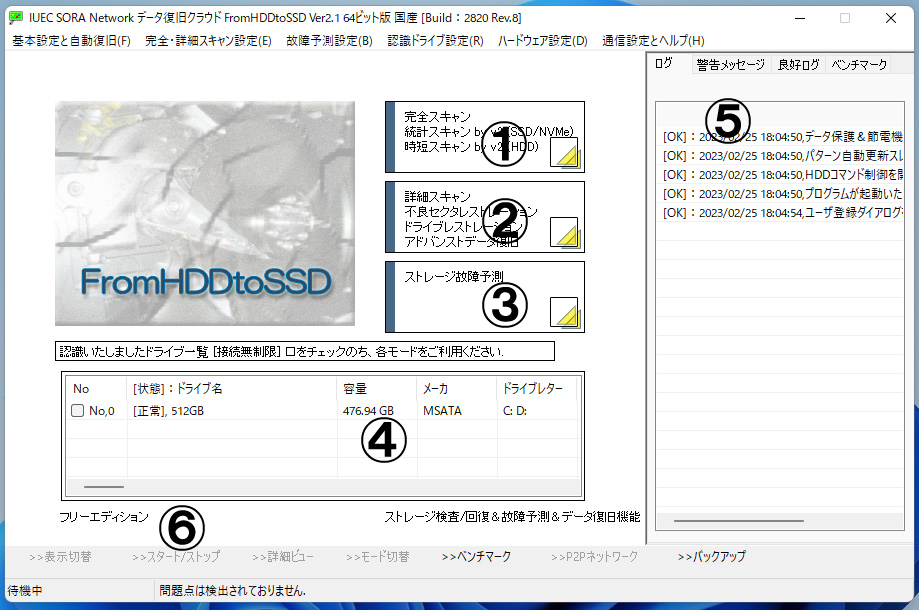
From No.4, choose the drive to run the inspection. Then click No.2 to open Advanced Data Recovery.
Millisecond inspection cannot be processed at the same time. Please run one by one.
Click No.3 “Bad Sector Danger Prediction”.
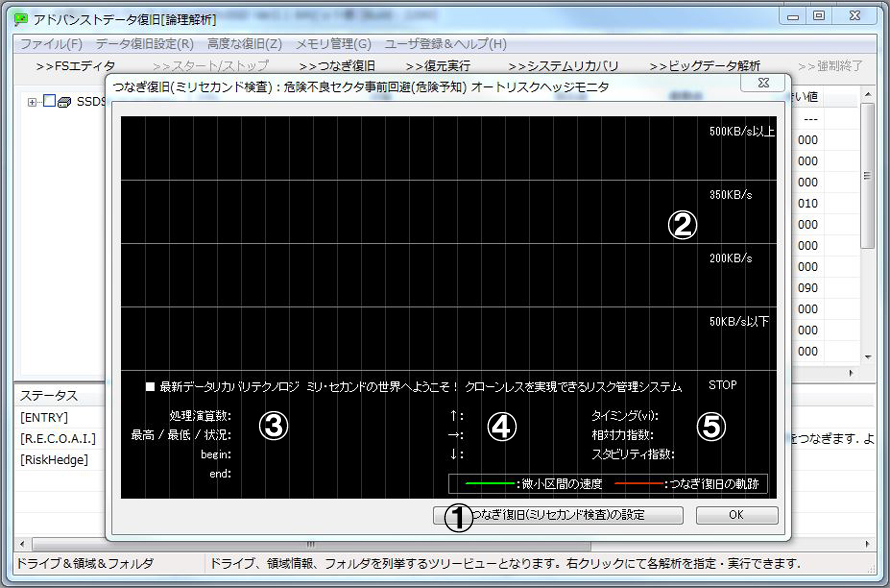
First of all, enable this feature.
Click No.1 “Setting bad sector danger prediction (millisecond inspection)”.
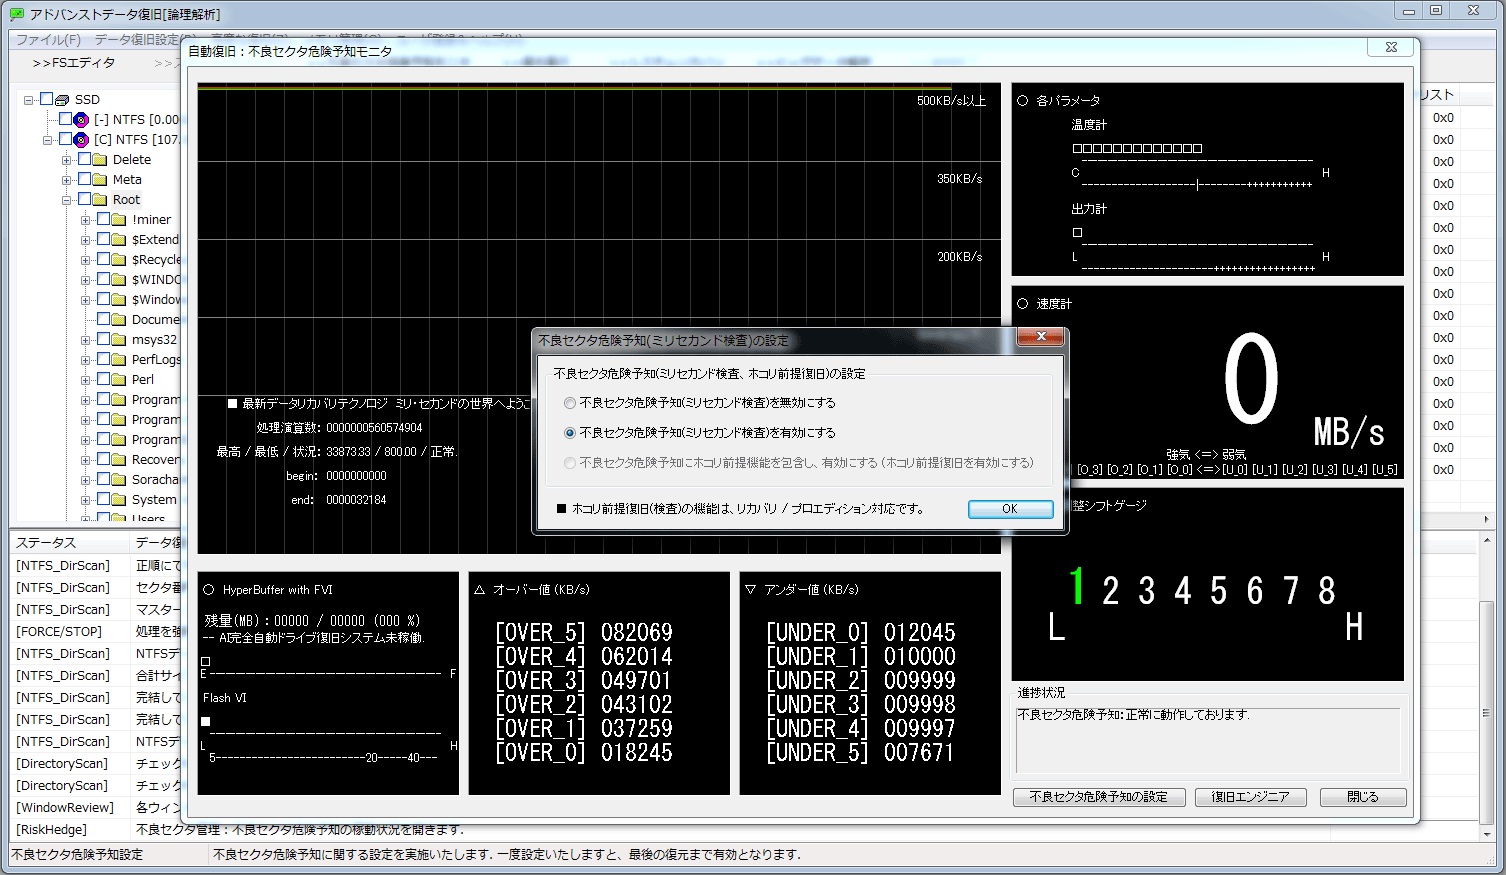
Choose “Enable bad sector risk prediction (millisecond inspection)” in the center from No.1 and click OK (No.2). The millisecond test is now valid. Actually, the bad sector danger prediction is diverted to the inspection.
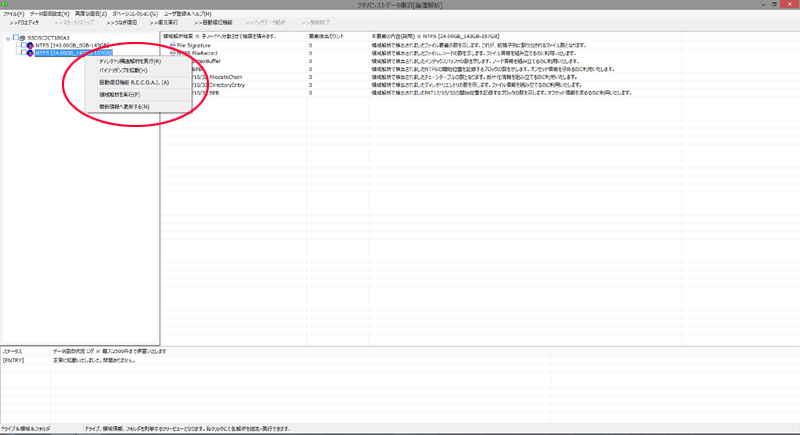
Do not close the “Bad sector danger prediction” dialog that appears move it to the right,
and double-click the drive name in the upper left (tree view).
Right-click on the area where run the inspection, and a menu will appear in the red circle above, click “Run directory structure analysis” at the top from here, and the process will start.
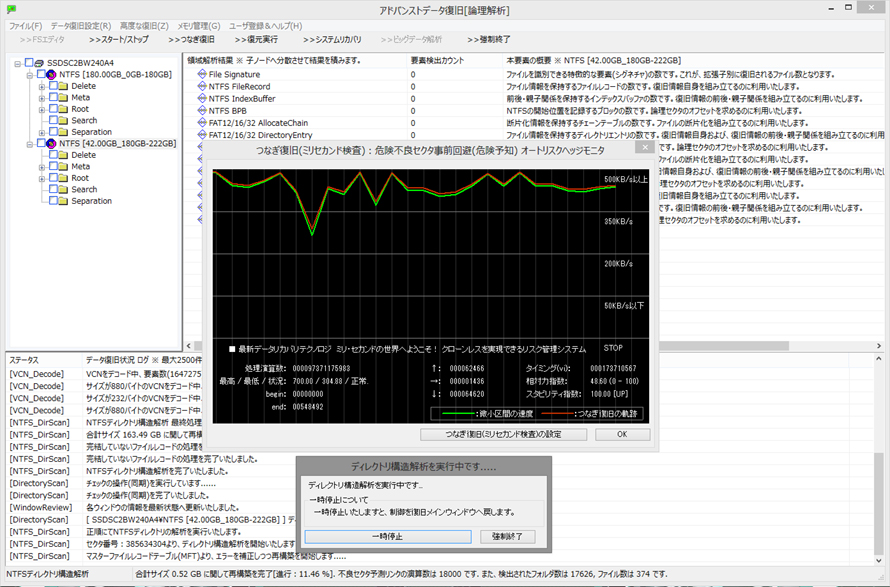
The analysis results will be displayed in a flowing. Then wait for the structural analysis to complete. By the way, this is a graph shape that is a normal sign, in the new UI, here is the graph in the upper left. We developed this dialog by extending this feature.
How to consider the graph
No.2: A graph that changes from moment to flows here, a drives that have no stability issues will stick near the top or return, immediately when lowered.
No.3: The processing amount is displayed. (Mainly for debugging)
No.4: The direction of the graph that changes from moment to moment is quantified and displayed at the top, slight change, and bottom.
No.5: This is the analysis result. However, only the “stability index” at the bottom can be used for inspection. This index denotes “drive strength” and is considered as [UP]. If there is no problem, and [DOWN], if there is a slight problem, the healthy drive is 60-100, which is [UP], if there are many weak parts, will be 50 or less, and the possibility of being judged as [DOWN] increases.
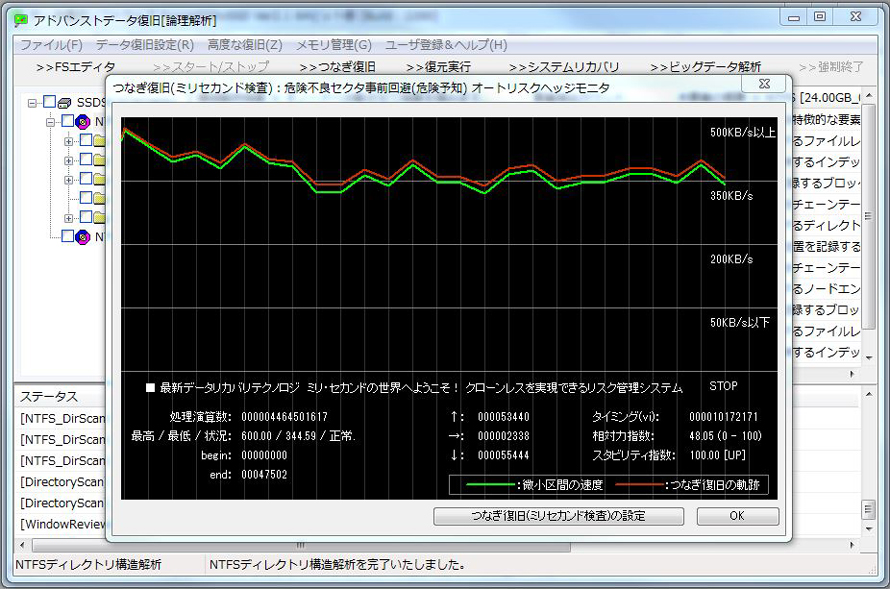
If there is no problem, to end with [UP].
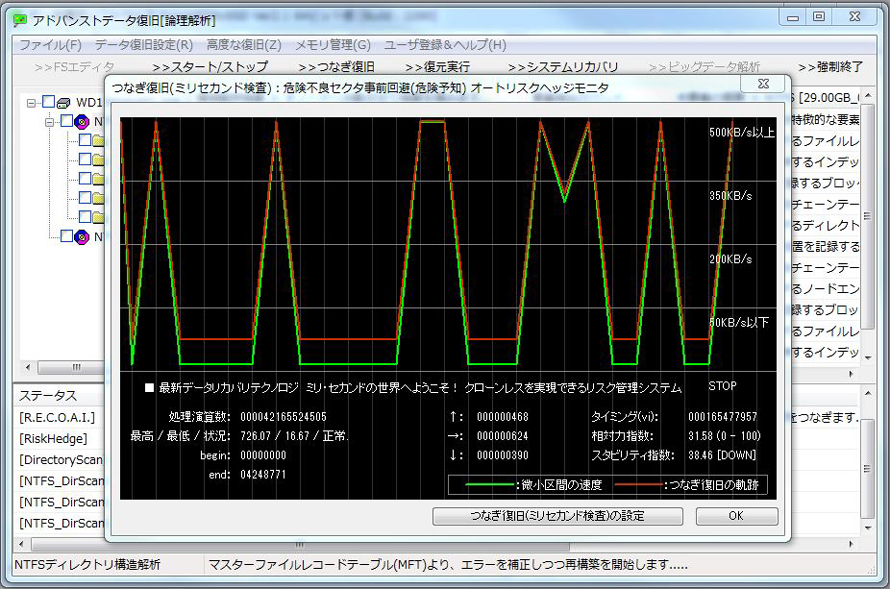
The operation is strange immediately after the start, and considered as [DOWN].
Bad sector danger prediction (red-line) works well to prevent from sticking to the bottom and getting stuck, this is a pre-avoidance.
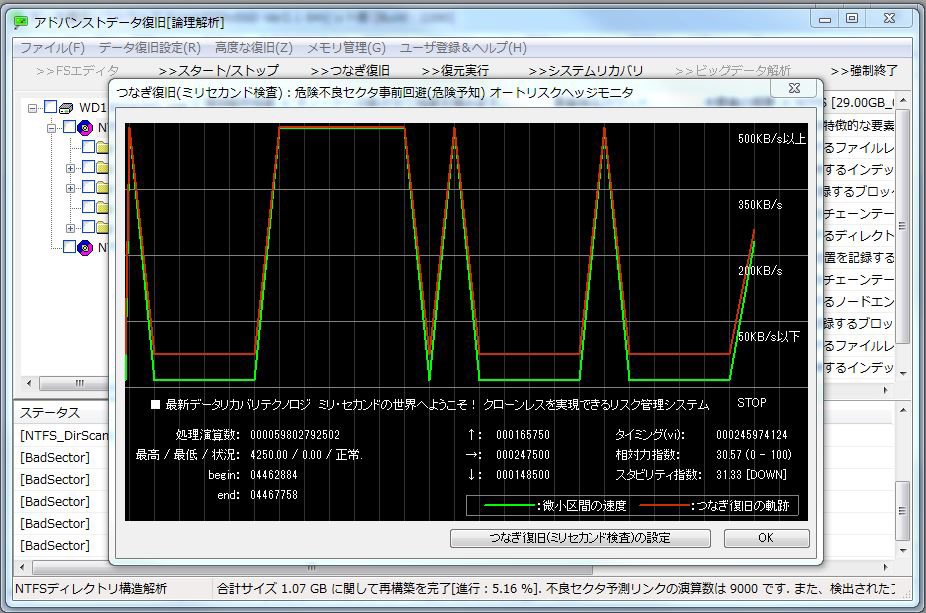
If the drive head is broken, will not recover anymore, and will continue to go down. Let’s give up and switch to a new one. However, this drive has bad sectors, so it is still good. If this is a drive that hides bad sectors to the end, only bad sector inspection will go unrecognizable without noticing the bad.